As real estate agents, this question, or some variation of it, is something we are asked often. With that being said, we are much more comfortable playing the role of real estate historians for our clients than we are real estate clairvoyants, so we like to lean on history for the answers whenever possible.
.
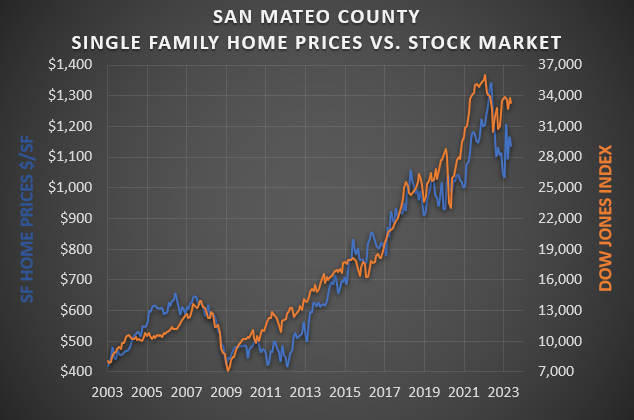
Thankfully, history has plenty to teach us about the behavior of Bay Area home prices. To start, if you are looking for a good barometer for home prices, the stock market has been remarkably reliable. The included chart compares San Mateo County home prices with the Dow Jones Index over the past 20 years, and you can see that, for the most part, they are pretty much aligned. So if we are in a period of volatility in the stock market, it is reasonable to expect that home prices will experience similar fluctuations, as we saw during much of last year.
.
This correlation is useful to keep in mind if you’re an investor looking for a short-term flip (price volatility could affect your returns), but if you are an end-user looking for your new home, the far more important historical lesson to be gleaned from this chart is that Bay Area home prices, like the stock market, trend upwards over time. Short-term price fluctuations shouldn’t be a huge factor in your decision to purchase a long-term investment like your primary residence. In these situations, it’s always better to let your personal goals and current financial circumstances guide your decision making, knowing that over the long-term, your investment should prove sound.
.
So where are home prices headed? Tomorrow – who knows? We’ll leave that guess work up to the day traders. But history gives us a pretty strong idea of where they’ll be in 3-5 years.
 Skip to content